How it Works
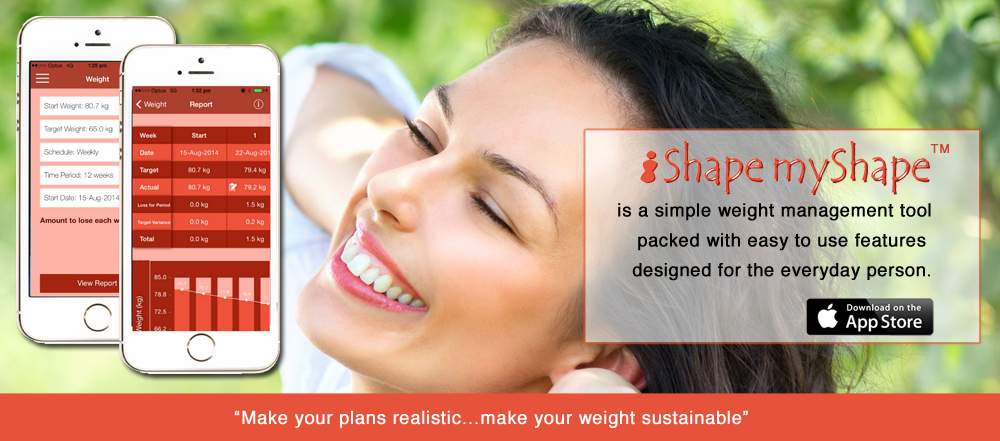
iShapemyShape™ is a simple weight management tool packed with easy to use features designed for the everyday person.
The iShapemyShape™ app is compatible with iPhone 4 and 5 (optimised for iPhone 5) and requires iOS 7.0 or later.
Below is an outline of each of the features - more detailed instructions are available from within the app:
- Profiles - set your profile name, choice of four colours, preference of units of measure (kg/gm-cms, lb-feet/inches, or st/lb-feet/inches), and your overall plan duration and monitoring frequency/intervals. Create multiple profiles enabling new plans, as well as plans for others, such as family and friends.
- Weight Management - set your target weight and monitor your progress over the duration of your plan, concentrating on small incremental changes at each interval.
- Body Measurements - monitor your body measurements and change in body shape at each interval throughout the duration of your plan.
- BMI (Body Mass Index) - calculate your BMI based on AUS, USA & UK guidelines for men and women over the age of 18.
- Exercise Plan - create, tailor and self-monitor exercise plans based on what works for you.
- Eating Plan - create, tailor and self-monitor meal plans based on what works for you.
- Hydration Plan - create, tailor and self-monitor hydration plans based on what works for you.
- Cumulative Graph - monitor and analyse your exercise, eating and hydration versus your weight.
- My Resources - save and manage links to websites you may have identified as being valuable resources in the management of your plans.
- iShapemyShape™ Web - access app help information and keep up to date with all the latest information, news and updates on iShapemyShape™.
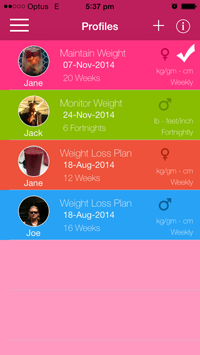
Profiles
You can have one or more profiles within the app. Within each profile you can create and monitor unique plans for Weight, Body Measurements, Exercise, Eating and Hydration.
Each plan you set your profile name, choice of colour, preference of units of measure (kg/gm-cm, lb-feet/inch or st/lb-feet/inch), and your overall plan duration and monitoring frequency/intervals.
Having the ability to create one or more profiles not only allows you to set up new plans once you have completed one, but also give you the option to set up plans for others, such as family and or friends. Additional profiles are created via the Profiles screen accessed from the main menu.
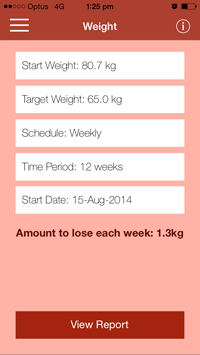
Weight Management
The Weight screen captures your Start and Target Weights and calculates and displays the amount to lose or gain per period based on the Units (of measure), Frequency, Duration and Start Date you set in the profile area.
In addition to monitoring weight loss or weight gain, if you are already at, or reach your goal weight, you can also monitor maintaining this weight if you wish. To do this, create your weight plan with the same weight values in both the Start and Target Weight fields. The amount to lose each period will show as zero. You will then be able to enter and monitor your weight via the Report area as usual.
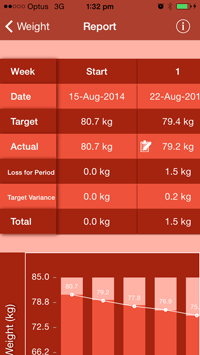
The Weight Report screen displays a scrollable Statistical Table and Graph, divided up into interval/periods based on the Start Date, Frequency and Duration, and Start and Target weights. Target Weights based on the calculated amount to lose or gain each period shown in the Weight screen, are displayed at each interval.
The Weight Report screen is also where you enter your Actual Weight for each interval/period, which is then plotted on the graph in relation to your target weight. It is also plotted on the Cumulative Graph in relation to your self-monitored Effort and Compliance levels from your Exercise, Eating and Hydration plans if used.
For each interval, the statistical table also calculates and displays the loss or gain for the period, the target variance for the period, and the total loss or gain since your plan commencement.
At any time, you can Export your Weight Management report for printing, messaging or emailing.
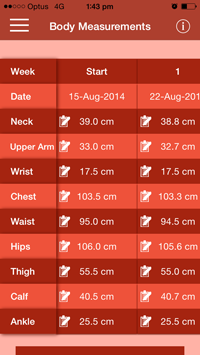
Body Measurements
The Body Measurements screen displays a scrollable table, divided up into body areas, and interval/periods based on the Start Date, Frequency and Duration set up in the Profile area.
You can choose which body areas you wish to measure and display. If you don’t wish to measure all body areas initially, you can choose to commence additional areas at any interval just by including them when adding your measurements, or via editing measurements. At any time you can choose to hide areas of measurement from the Statistics table by de-selecting the area of measurement via the Add or Edit Measurements screens
To ensure accuracy when taking your measurements, try to measure in exactly the same place and under the same conditions each time. In addition to monitoring a decrease or increase in measurements, if you are already at, or reach your goal measurements, you can also monitor maintaining these measurements if you wish.
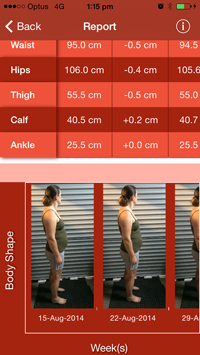
The Body Measurements Report screen displays:
- A scrollable Statistical Table displaying your Start measurements for each body area being recorded, your loss or gain, and your current measurements.
- A scrollable Body Image table, divided up into interval/periods based on the Start Date, Frequency and Duration set up in the Profile area.
The recording of measurements and capturing of images are both optional - you can choose to do one or the other, or both. If you choose to capture your body image, whatever position you choose at the beginning for recording your shape, continue with this same position so you can easily monitor your change in shape over time. Note - images taken via the app for the image table are stored within the app only.
At any time, you can Export your Body Measurements report for printing, messaging or emailing.
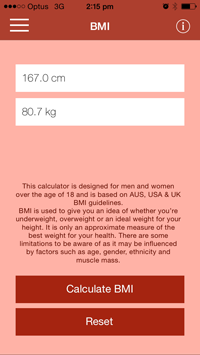
BMI (Body Mass Index)
The BMI (Body Mass Index) screen allows you to calculate your BMI and is designed for men and women over the age of 18 and is based on AUS, USA & UK BMI guidelines.
BMI is based on your height and weight and is used to give you an idea of whether you’re underweight, overweight or an ideal weight for your height.
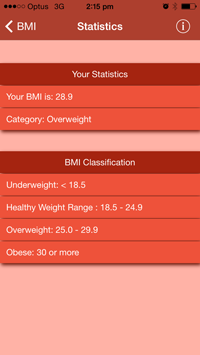
The BMI Statistics screen displays your calculated BMI value and Category, along with the BMI Classifications and their value ranges based on the AUS, USA & UK BMI guidelines.
BMI is only an approximate measure of the best weight for your health. There are some limitations to be aware of as it may be influenced by factors such as age, gender, ethnicity and muscle mass.
Exercise Plan
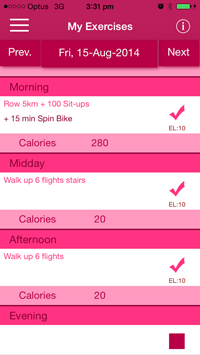
The My Exercises screen allows you to set up, view and self-monitor your exercise plan, or alternatively enter it as you go. For preference of when you exercise, it is split into Morning, Midday, Afternoon and Evening. This app will not determine calories based on your exercises, however you can record calories for each exercise if you wish.
The Exercise Plan, Eating Plan and Hydration Plan modules work in the same way and are optional. The plans are based on the overall Start Date, Frequency and Duration set up in the Profile area.
For each exercise completed, you mark off a value from 1 to 10 for what you consider reflects your Effort Level, 10 being the highest effort. Along with your Effort Level, you can also include a comment. Effort Levels for the interval/period are totalled as you go and an average calculated and plotted on the My Exercises Report graph, so you can track how you are progressing at any given time. The values are also plotted on the Cumulative Graph in relation to your weight.
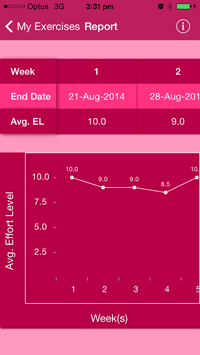
The My Exercises Report screen displays a scrollable Statistical Table and Graph, divided up into interval/periods based on the overall Start Date, Frequency and Duration set up in the Profile area.
Each interval/period displays and plots your current average Effort Level for that period/interval, so that you can track how you are progressing at any given time. The average Effort Level values are also plotted on the Cumulative Graph in relation to your weight.
The average Effort Level is calculated by totalling all the effort level values entered for exercises within an interval/period, divided by the number of exercises marked off within that interval/period.
At any time, you Export your Exercise Plan for a selected duration for printing, messaging or emailing.
Eating Plan
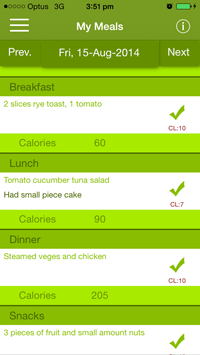
The My Meals screen allows you to set up, view and self-monitor your eating plan, or alternatively enter it as you go. The plan is split up into Breakfast, Lunch, Dinner and Snacks. This app will not determine calories based on meals, however you can record calories for each meal if you wish.
The Eating Plan, Exercise Plan and Hydration Plan modules work in the same way and are optional. The plans are based on the overall Start Date, Frequency and Duration set up in the Profile area.
For each planned meal consumed, you mark off a value from 1 to 10 for what you consider reflects your Compliance Level, 10 being the highest compliance. Along with your Compliance Level, you can also include a comment. Compliance Levels for the interval/period are totalled as you go and an average calculated and plotted on the My Meals Report graph, so you can track how you are progressing at any given time. The values are also plotted on the Cumulative Graph in relation to your weight.
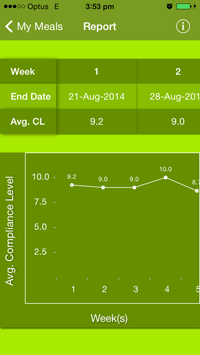
The My Meals Report screen displays a scrollable Statistical Table and Graph, divided up into interval/periods based on the overall Start Date, Frequency and Duration set up in the Profile area.
Each interval/period displays and plots the current average Compliance Level for that period/interval, so that you can track how you are progressing at any given time. The average Compliance Level values are also plotted on the Cumulative Graph in relation to your weight.
The average Compliance Level is calculated by totalling all the compliance level values entered for meals within an interval/period, divided by the number of meals marked off within that interval/period.
At any time, you Export your Eating Plan for a selected duration for printing, messaging or emailing.
Hydration Plan
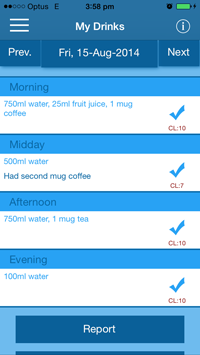
The My Drinks screen allows you to set up, view and self-monitor your hydration plan, or alternatively enter it as you go. The plan is split up into Morning, Midday, Afternoon and Evening.
The Hydration Plan, Exercise Plan and Eating Plan modules work in the same way and are optional. The plans are based on the overall Start Date, Frequency and Duration set up in the Profile area.
For planned drinks consumed, you mark off a value from 1 to 10 for what you consider reflects your Compliance Level, 10 being the highest compliance. Along with your Compliance Level, you can also include a comment. Compliance Levels for the interval/period are totalled as you go and an average calculated and plotted on the My Drinks Report graph, so you can track how you are progressing at any given time. The values are also plotted on the Cumulative Graph in relation to your weight.
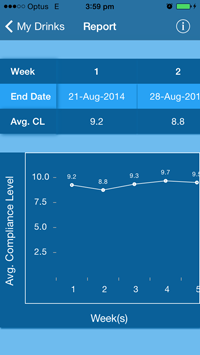
The My Drinks Report screen displays a scrollable Statistical Table and Graph, divided up into interval/periods based on the overall Start Date, Frequency and Duration set up in the Profile area.
Each interval/period displays and plots the current average Compliance Level for that period/interval, so that you can track how you are progressing at any given time. The average Compliance Level values are also plotted on the Cumulative Graph in relation to your weight.
The average Compliance Level is calculated by totalling all the compliance level values entered for drinks within an interval/period, divided by the number of drinks marked off within that interval/period.
At any time, you Export your Hydration Plan for a selected duration for printing, messaging or emailing.
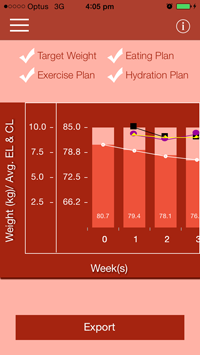
Cumulative Graph
To activate the Cumulative Graph you must utilise the Weight Management module, even if it is just to maintain your current weight.
The Cumulative Graph screen displays a scrollable Graph, divided up into interval/periods based on the overall Start Date, Frequency and Duration set up in the Profile area. These are the same interval/periods shown in the Weight Management, Body Measurements, Exercise, Eating and Hydration Plans.
Your Target Weights and entered Actual Weights for each interval/period are displayed in combination with data from your Exercise Plan, Eating Plan and Hydration Plan if utilised.
By default, information for each of the data types is displayed in the graph, which is indicated by a tick next to each title. Apart from Actual Weight, you can deselect data types from temporarily displaying in the graph.
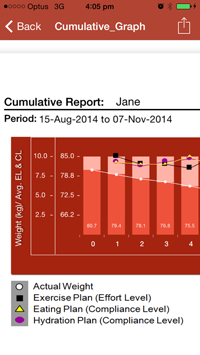
At any time, you Export your Cumulative Graph for printing, messaging or emailing.
A legend is shown at the bottom of your report as a reminder of which plotted data belongs to which data type.
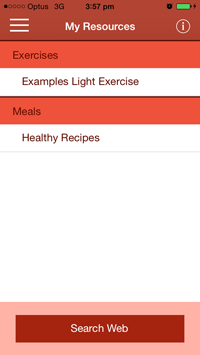
My Resources
The My Resources screen displays your saved links to websites you may have identified as being valuable resources in the management of your plans.
You can search for, name and save links within folders for ease of identification and retrieval when needed.
By default the My Resources screen will be blank prior to any links or folders being added. Once added, Folders and Links are sorted alphabetically. Tip – save a link to your favourite search engine for ease of locating sites/resources.
Note – searching and viewing websites via My Resources module relies on and uses your phone/plan data.

iShapemyShape™ Web
The iShapemyShape™ Web screen lets you view and keep up to date with all the latest information and updates on the iShapemyShape™ web page.
You can access help information, view how we are tracking with our 'weight for weight’, contact us with any questions or suggestions, access our Placebo page, and email the web link to family and friends.
iShapemyShape™ is all about you and your shape!
![]()